Binary Options indicators, here there are an list with downloads of indicators binary options for metatrader 4 . You can apply these indicators on all time frame.
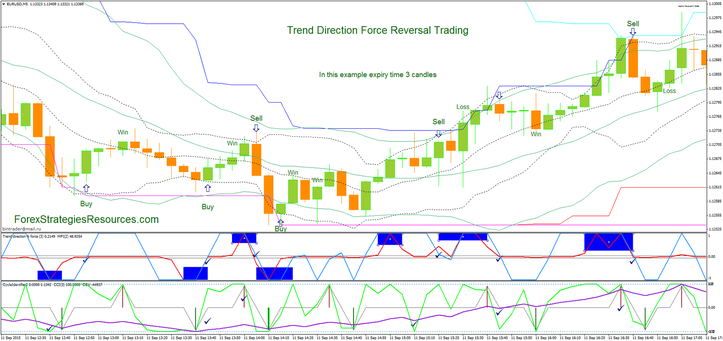
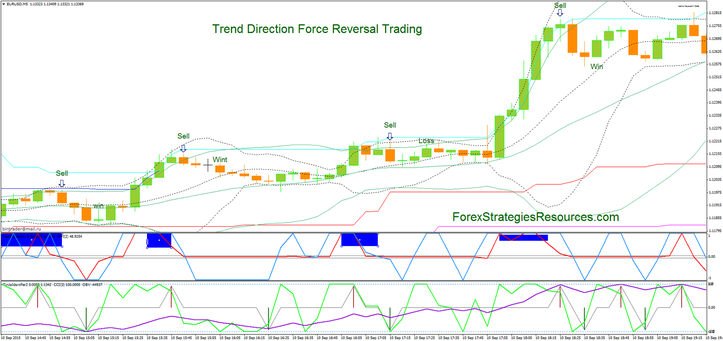
Trend Direction Reversal Trading is a binary options strategy that is good also for scalping based on Trend direction force , Money flow index and OBV indicator.
Time Frame 5 min or higher.
Financial markets: Forex, Indices and Commodities.
This trading system is for any sessions but do not trade before the economic news.
Expiry Time 2-3 candles.
Metatrader indicators:
Optional indicators
Bollinger Bands (20, 2),
Bollinger Bands (10, 2),
SR TLB,
Donchian Channel,
1a-ps mt.
Trend Direction force V.3.
Money Flow Index (2),
Cycle Identifier,
Commodity Channel Index (3),
On Balance Volume.
Trend Direction Force Reversal Trading Rules (level 1)
Buy
When Trend Direction Force touches -1 level wait the following conditions:
Money Flow index crosses upward Trend Direction Force,
Commodity Channel Index crosses upward Money Flow Index.
Price retraces below upper band (10, 2) optional.
Sell
When Trend Direction Force touches +1 level wait the following conditions:
Money Flow index crosses upward Trend Direction Force,
Commodity Channel Index crosses upward Money Flow Index.
Price retraces above lower band (10, 2) optional.
Profit Target (TF 5 min) 8-10 pips or middle band of Bollinger Bands (20, 2).
Place stop loss below lower band of BB (20, 2) for buy or above upper band of BB (20, 2) for sell.
In the pictures Trend Direction Force Reversal Trading in action.
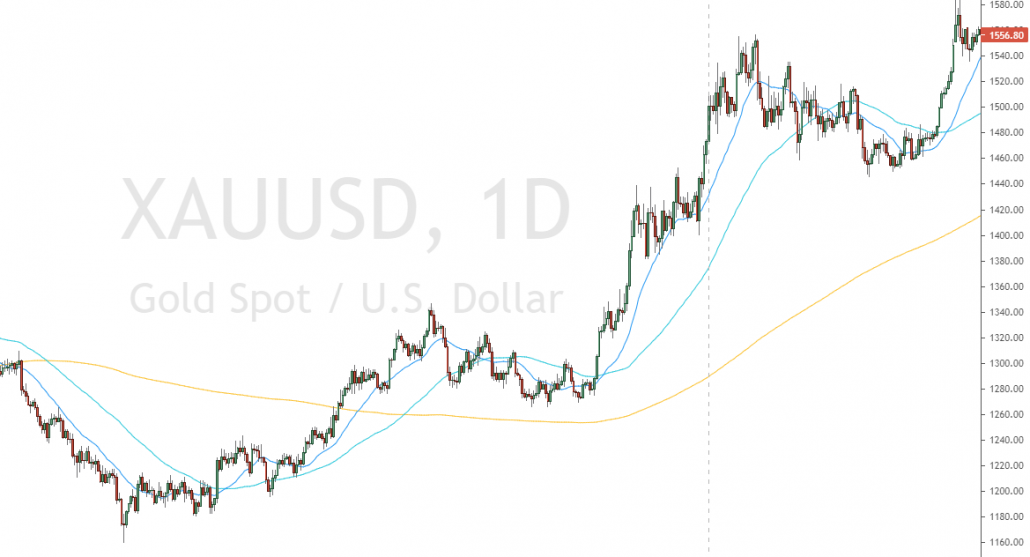
Once you’ve spent some time studying the market and have some experience, you can consider using the rainbow pattern strategy to increase the chances of successful trading. The strategy combines simple signals to make sophisticated predictions about the price.
The rainbow pattern strategy involves using many moving averages with different periods, and each of them is identified by a different color (hence the name “rainbow pattern”).
Moving averages that use many periods don’t react to price changes as quickly as moving averages with fewer periods.
When there’s a strong movement, the moving averages will be stocked from slowest to fastest in the trend direction.
The fastest-moving average will be closest to the price; the second-fastest will be the second closest, and so on.
When you see that multiple moving averages are stacked in the right way, you will know that the price is making a strong movement in one direction. This is the right time to invest.
While you can use as many moving averages as you like, most traders use three.
Trading with multiple Moving Averages
If the shortest moving average is above the medium one, which is above the longest moving average, bet on the prices rising. If the shortest average is below the medium average, which is below the longest moving average, you must bet on the prices falling.
While you can set the moving averages to have any number of periods, consider doubling the number of periods in each moving average.
The ratio guarantees that the averages are just different enough to create a helpful and accurate signal. Using the most popular values, 5, 10, and 15 is the right way to go if you’re a beginner. You will see the same opportunities that other traders do, allowing you to tune into the inside knowledge the rest of the market has.
When your moving averages are stacked in the right order, you can:
Invest immediately: Most signals are created right after the final moving average aligns itself the right way. While there is a lot of potential for profit, the risk is just as high.
Wait for one period: Waiting for a period to see if the moving averages remain in the same order will bring about a lot of security.
Wait for a couple of periods: You can play it very safe and wait for two or more periods to confirm the signal. But keep in mind that waiting too long will reduce the accuracy of your signal. By that time, the market may also begin to turn the other way. If you do decide to wait, make sure it’s no longer than three periods.
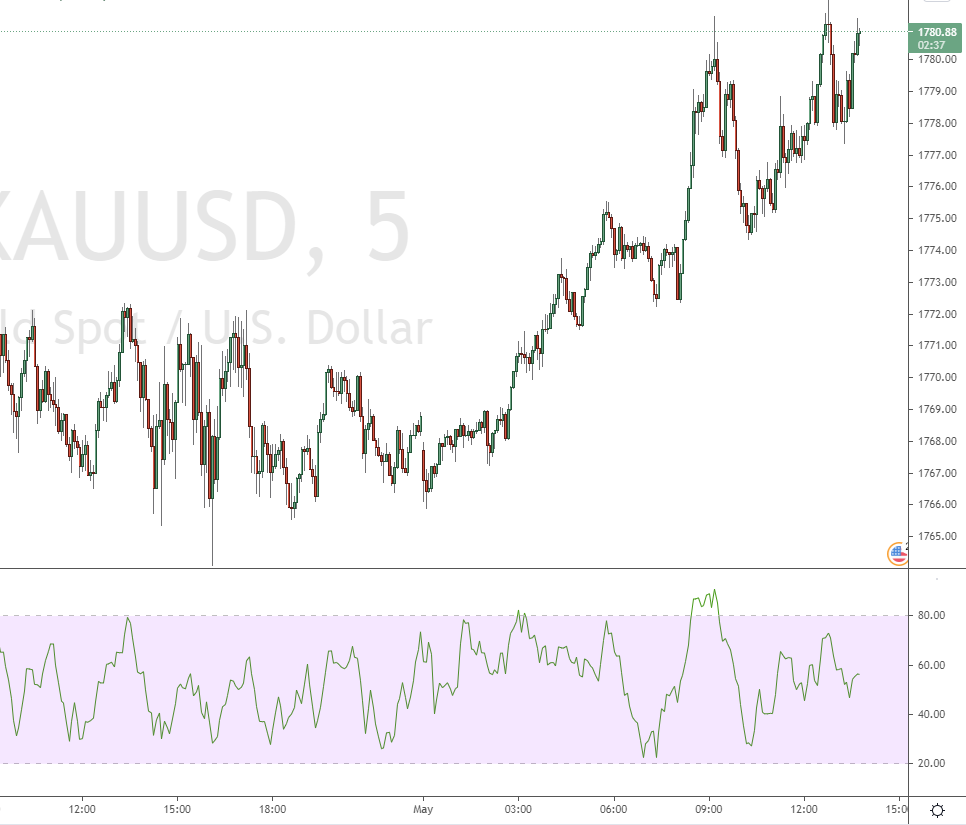
Using the MFI indicator is one of the most effective ways to make money using Binary Options in short periods. It’s one of the best five-minute strategies out there.
One of the things you need to know about trading Binary Options is that the market isn’t as random in the short term. Furthermore, since your capital will be blocked for a short time, you will be able to make many more trades in a day.
However, all short-term strategies are based on technical analysis, including this one. This is because no stock’s price rises or falls in the short-term because the company behind it is doing well or badly.
In short periods, the only thing that influences the price of assets is the supply and the demand. Technical analysis is the only way to understand if traders are buying or selling, and one of the best indicators that help you understand this relationship is the Money Flow Index (MFI) indicator.
The indicator compares the number of assets sold to the number of assets bought, generating a value between 0 and 100.
Money Flow Index indicator strategy
Here’s how the indicator works:
If the value is 0, all the active traders want to sell the asset.
If the value is 100, all the active traders want to buy the asset.
If the value is 50, the number of active traders wanting to buy and sell the asset is equal.
If you understand the relationship between the traders that are buying and selling an asset, you can also estimate what will happen to the price of the asset since it is determined by supply and demand.
If too many traders have bought an asset, there aren’t many traders left to push the price upwards. The demand will go down, and the price will fall.
Similarly, if too many traders have sold an asset, there aren’t many traders to push the price down. The supply will exhaust, and the market will rise.
Now that you understand how the market works, here’s how you can use the MFI indicator to your advantage:
If the MFI is >80, the asset is overbought, and the price will likely fall soon.
If the MFI is <20, the asset is oversold, and the price will likely start to rise soon.
If you find that the MFI of an asset is >80, you can invest in a low binary option to make a profit. In contrast, if the MFI of an asset is <20, you can invest in a high binary option to make a profit.
The MFI strategy works exceptionally well in five-minute spans. However, in the long run, and in periods longer than a year, the MFI remains in the extremes.
The fundamental influences have a strong effect on the asset and will push the price in the same direction for years. Using this strategy to make long-term trades won’t work out well for you.